Think Google Maps for Solar. Think PV Potential.
Think Google Maps for solar. This is what the Australian PV Association (APVA) plans to produce. The APVA is investing in an interactive solar mapping web interface and working in collaboration with utilities, policy stakeholders and universities to execute the project. The map will combine 3D solar modelling with layers of data to identify potential PV areas, demonstrate PV generation and track the growth of solar across Australia.
Homeowners, installers, utility providers, city planners and local policy makers can all benefit from the data acquired from solar maps, but can Australia capture the real potential of this tool to develop a sustainable solar marketplace across the country?
NYC Solar Map
The City University of New York (CUNY) leads the way with solar mapping. University Director of Sustainability at CUNY, Tria Case, recently presented at the APVA Solar Mapping Workshop in Sydney, Australia to share experiences and lessons learned. The solar map is an interactive online tool that allows users to estimate the solar energy potential for every building in New York City’s five boroughs by inputting an address. It is part of an effort to convince more New Yorkers to install solar on rooftops.
Most property owners are unaware of how much solar power potential exists on their roofs, where other systems have been installed in the area (and by whom), how much an installation will cost, and how cost-effective it can be in relation to their energy bills. The NYC map highlights existing solar installations, displays real-time solar energy production city-wide and allows users to estimate the cost, incentives and payback period for investing in solar. Last year, the city’s marketplace grew faster than the state and the solar map was certainly a key contributor.

Technology
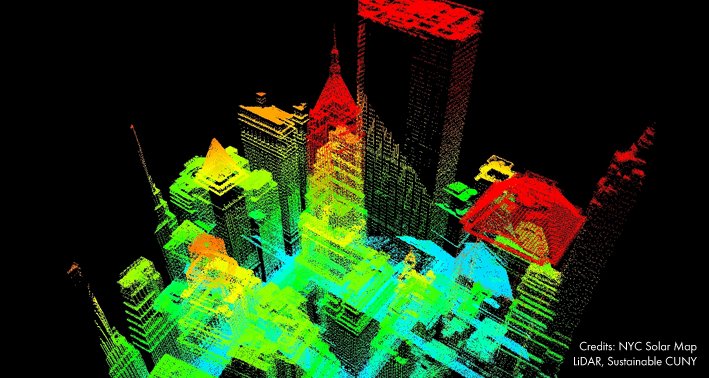
The first generation of solar maps was based on the analysis of 2D aerial images, like that of Google maps, but today we can construct 3D models of towns and cities using advanced technologies such as Light Detection and Ranging or LiDAR. Airbourne LiDAR is an optical remote sensing technology that measures properties of scattered light to find range and information of a distant target.
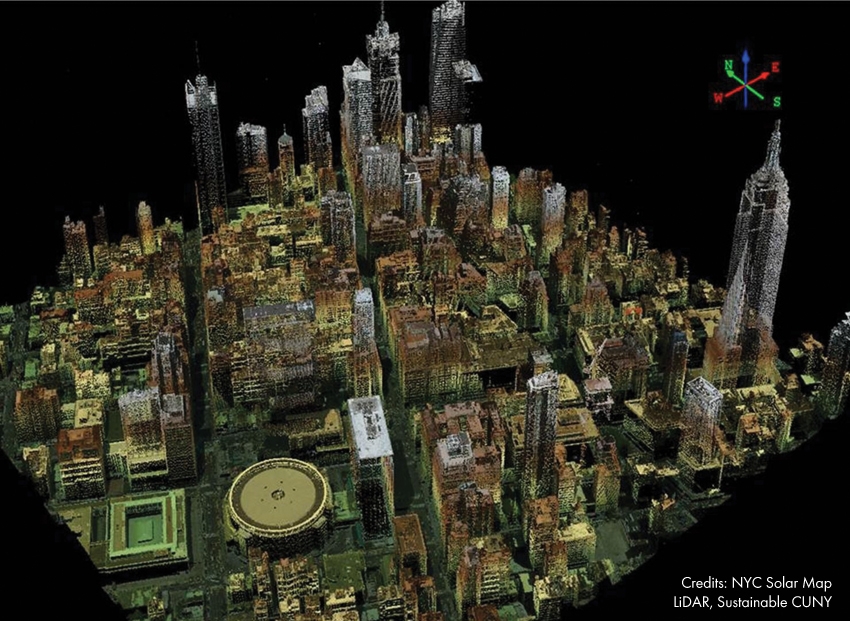
Credit: NYC Solar Map LiDAR, Sustainable CUNY
This data is used to build digital elevation models of urban areas with high spatial resolution and can precisely determine the impact of obstructions to solar radiation, identify roof tilt and estimate the amount of roof area that can be used for a solar installation. The topographic data is combined with meteorological and financial data.
The meteorological layer of data identifies how much solar resource is available for solar PV systems while the third layer, financial and incentive data, is used to calculate the economics associated with a given installation.
This typically includes installation costs and electricity rates, but Australia should choose to go beyond these three levels to include additional features. The APVA mentioned links to local installers, new stories, information on permitting processes and an incentive calculator, amongst others. For the APVA, it’s all about exposure. The more you publicise it, the more consumers will buy into it and hopefully buy into solar PV.
Types of users:
1) Homeowner
For the homeowner, a solar map should be a source of information, a community. This type of user can utilize solar maps to make a complete assessment of the solar potential of their property. They have the ability to calculate the true value of going solar, potential energy savings and return on investment. Solar maps give a basic understanding of where PV is growing and could help dispel the myth that solar is expensive and only for upper class neighbourhoods. For this type of user it’s really about education.
2) Utility providers
The data will be particularly useful for utility providers and Australia must work in collaboration with utility companies in order to make this a success. Data will allow utilities to evaluate the impact of solar production on network reliability, integrate solar into smart grid efforts and improve demand-side management applications. Utilities will be able to gauge the distribution of projects within their territory, predict future distribution congestion issues and build better infrastructure to address supply and demand issues.
3) Installers
Installers will be able to determine where to focus their business efforts. They can use solar maps to enhance their marketing and outreach efforts and perhaps even promote their services if such functionality is integrated. It would be a good feature if the Australian map enables installers to extract data to develop targeted mailing lists for properties with high solar potential or develop return on investment models for potential customers.
Policy stakeholders will also have the ability to analyse the actual value of PV generation in grid-constrained areas and therefore the data could play a crucial part in designing solar policies and programs.
Conclusion
Solar maps have the potential to play a pivotal role in creating a sustainable solar marketplace worldwide. They can help inform policy makers, boost technological development, increase manufacturing capacity and boost solar uptake across the country. Australia needs to ensure the tool is rich in data and must guarantee sustainable and open collaboration between all parties.
Thanks to solar maps, American communities are already realizing their solar potential and the financial and environmental benefits associated with capturing that potential. Solar maps really can help achieve the goals to foster the market for renewable energy. We don’t want to see Australia’s solar map collecting dust on the virtual shelf.


Feel free to contribute!