Detailed Analysis of Commercial Battery Storage Systems with Analysis Pro
Batteries are taking on an increasingly important role in decentralized energy systems and constitute the heart of off-grid systems. They can also be increasingly found in on-grid systems, where they can cut energy purchase costs by means of increased self-consumption or peak load shaving. Battery monitoring plays a key role here. After all, PV system operators want to know whether their systems are actually working as intended, because downtime costs money and causes hassle. That is why SMA is offering a comprehensive upgrade for battery analysis via ennexOS.
Battery monitoring across three levels
With ennexOS, the battery system can be monitored across three “levels.”
- First, at the system level, you have the system energy balance. This provides users with an overview of all energy flows on the generation and consumption sides. The colored areas on the diagram are bordered by total generation and consumption in grey. The colors show where the energy has come from and where it has gone (Figure 1).
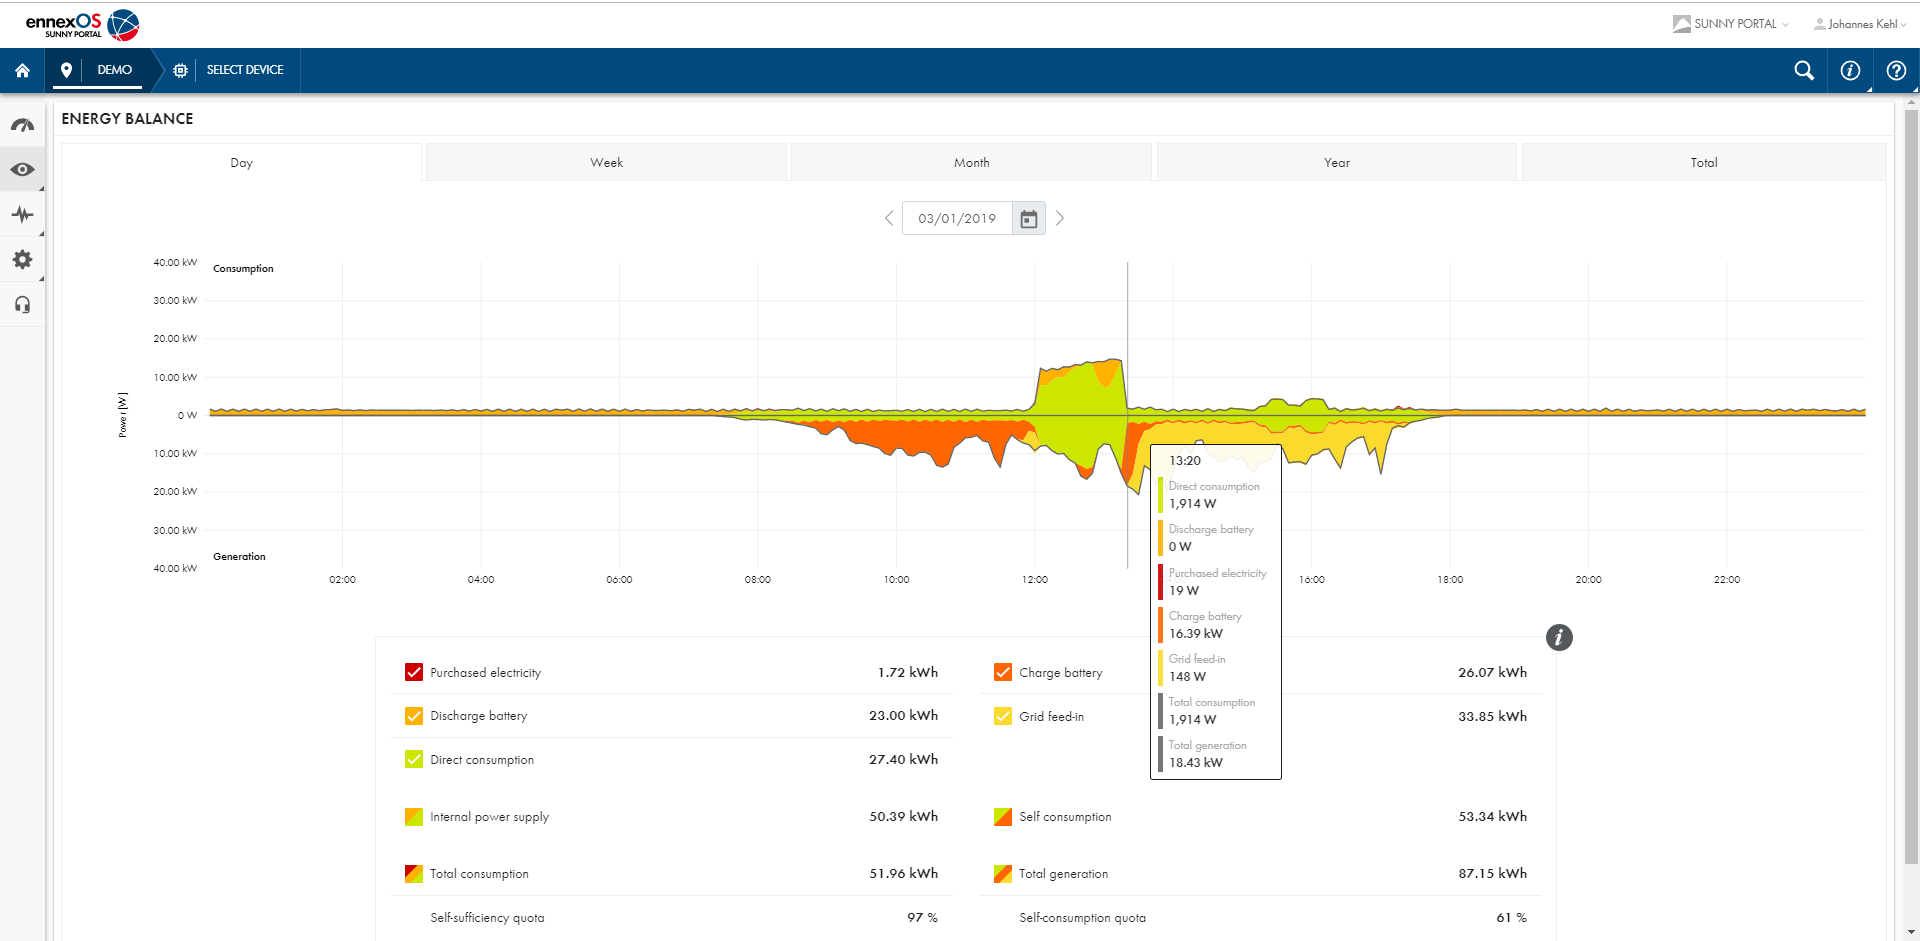
Figure 1: System energy balance
- Under “Energy and power – battery”, the device level shows the key data for the battery system at a glance. The battery display familiar from the system dashboard can be found in the top left. This shows the state of charge and system power. One handy feature is the time stamp above the battery icon, which changes depending on the SOC. It shows how recent the displayed values are (Figure 2). Our measured values were transmitted four minutes ago. Everything’s fine.
PV system operators can also use the chart to view past battery usage and how the state of charge has changed over the previous hours, days, weeks or months.
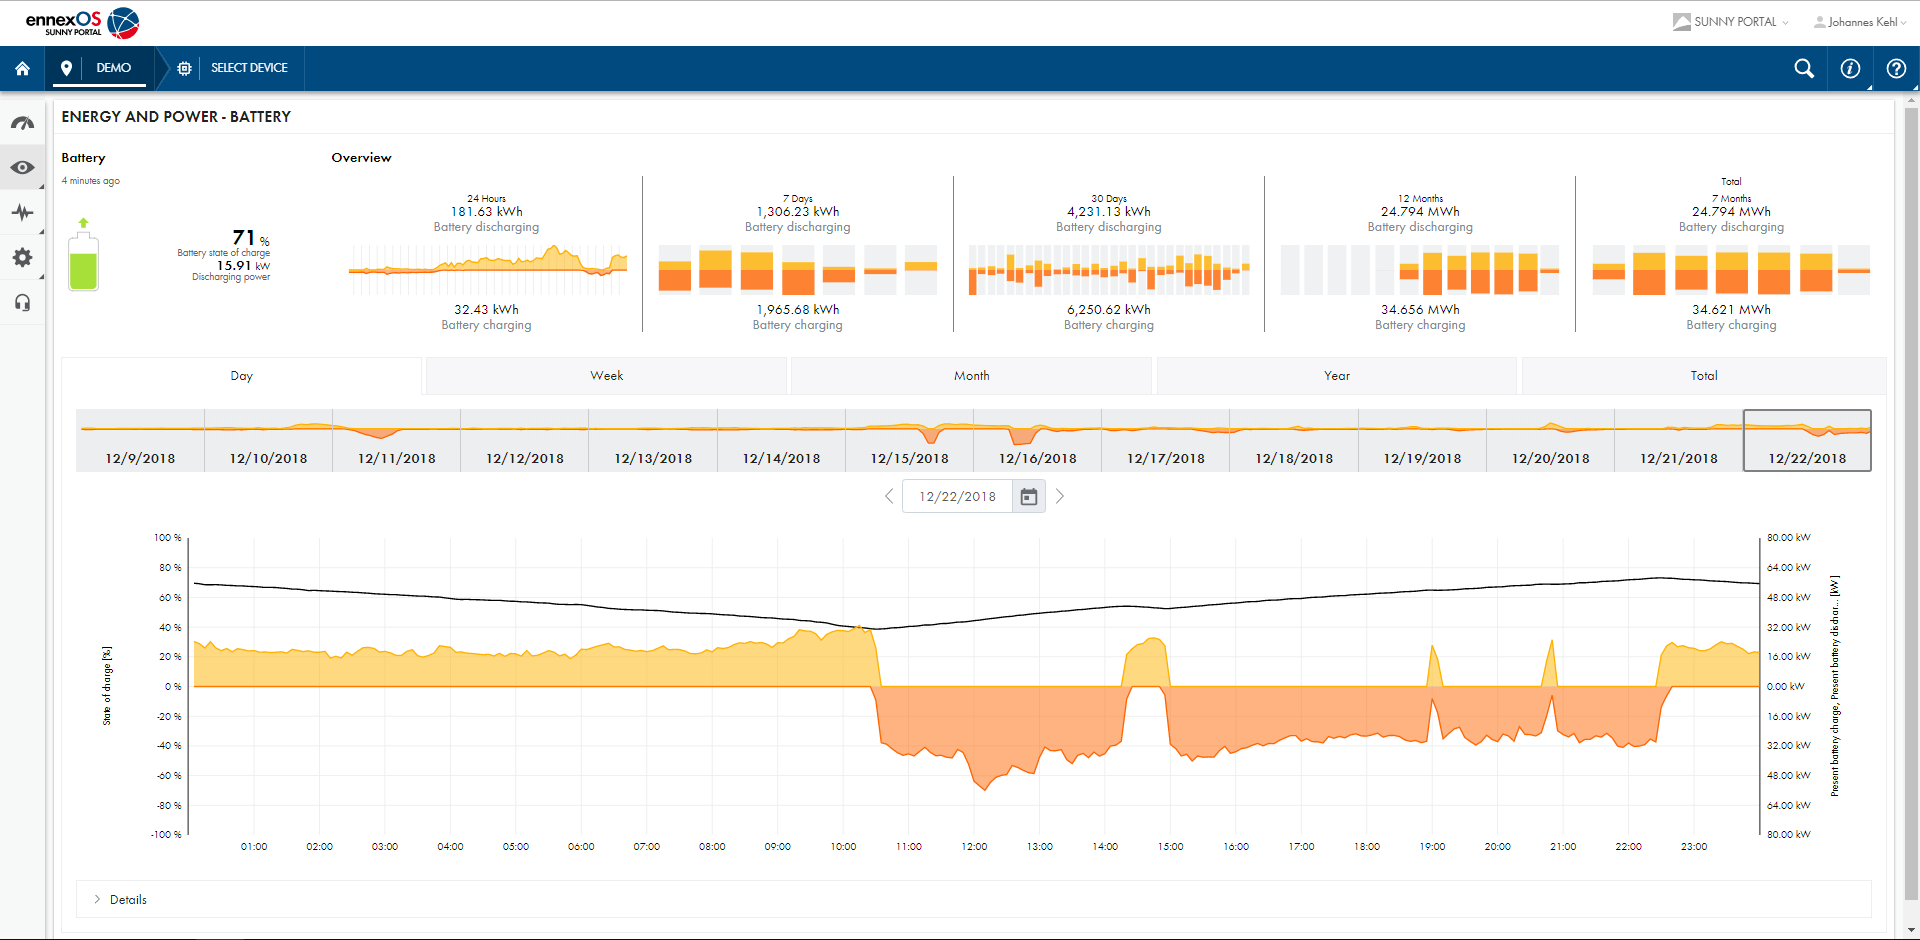
Figure 2: “Energy and power – battery”
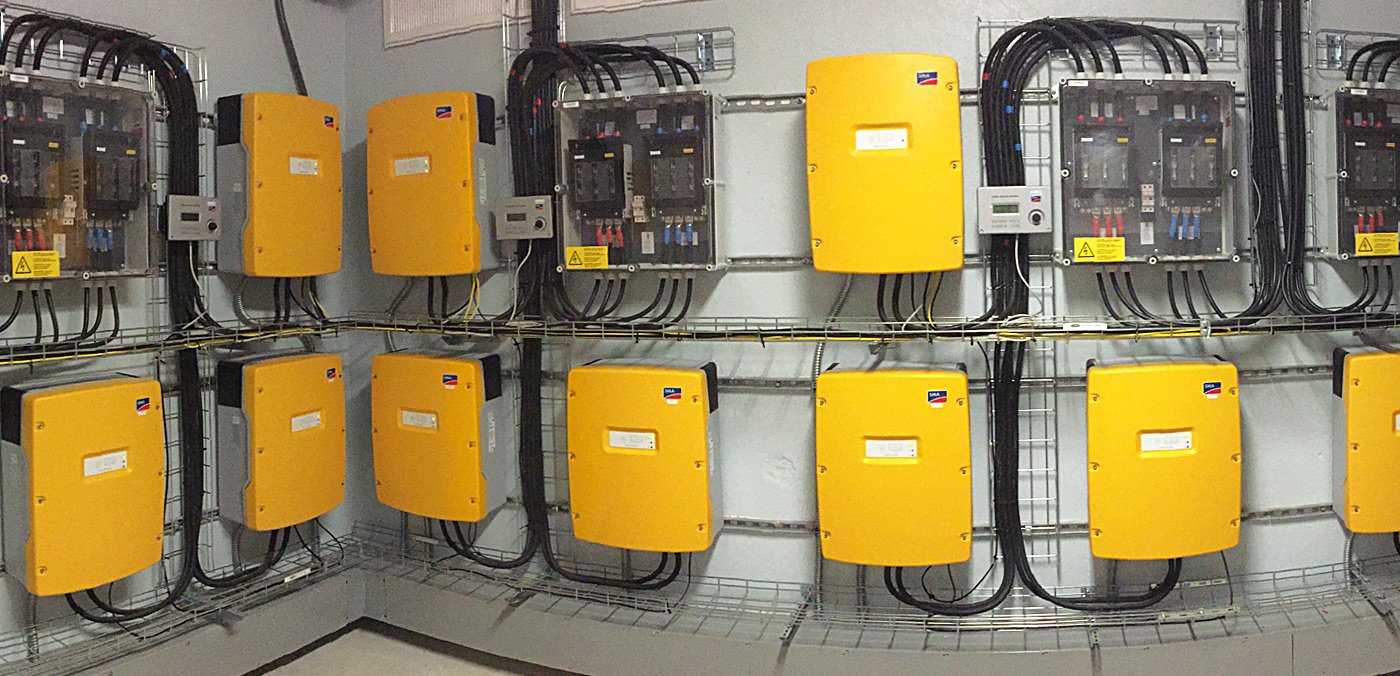
- Many customers, particularly those operating on a commercial scale, use multiple battery inverters, e.g., in the Sunny Island Multicluster format (Figure 3). For these systems, just as for PV inverters, Sunny Portal powered by ennexOS offers a range of visualization options at the device and system levels. For the first time, the energy and power values can be displayed in Sunny Portal at the system level alongside the existing data at the inverter level. The state of charge thus constitutes a mean value for all batteries in the system – weighted by their true capacity, of course.
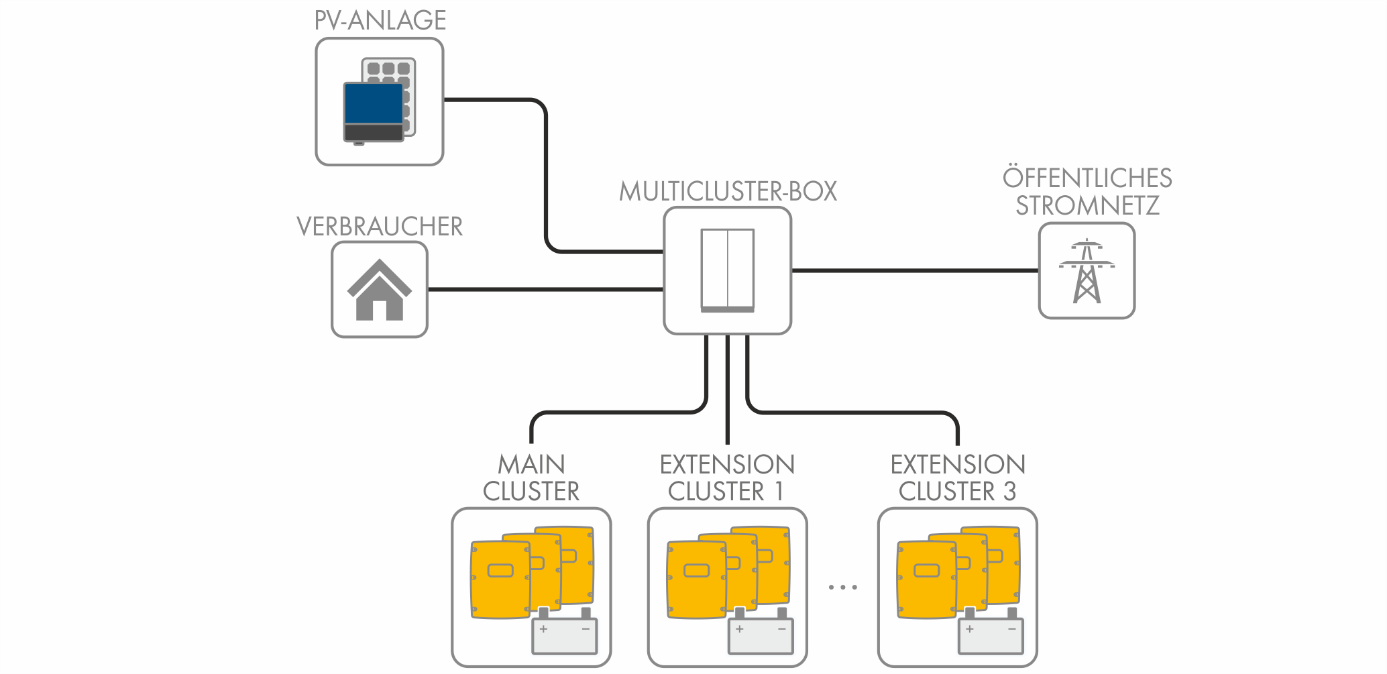
Figure 3: Sunny Island Multicluster
Tip: If, on a given day, you view the “Energy and power – battery” screen at the device level and then go through the monitoring menu (Figure 4) to switch to “Energy and power – battery” at the system level, the day that you had previously selected will be adopted.
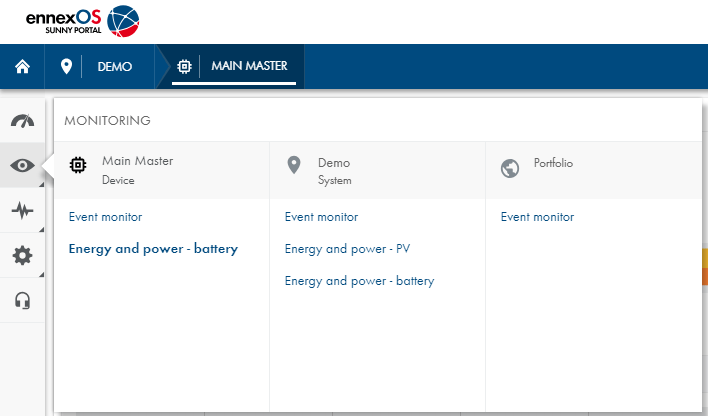
Figure 4: Distinction between device and system level in Sunny Portal powered by ennexOS
Analyzing the details
Many customers will already know the Analysis Pro tool from the subscription-based Sunny Portal Professional Package. When purchasing an SMA Data Manager M (EDMM-10), the tool is currently available only as part of the “Monitoring and Control” bundle and includes a number of functions in the Data Manager software and in Sunny Portal. This means that the Analysis Pro tool is already included into Sunny Portal powered by ennexOS and now also includes a range of useful functions for analyzing battery systems. In addition to the familiar grid analysis features (active and reactive power, frequency and AC current and voltage), Analysis Pro now also offers various new analysis options for the battery itself. The following data can be displayed in five-minute intervals:
- State of charge (SOC) as %
- State of health (SOH) as %
- Battery charge and discharge power in W
- Battery temperature in °C
- Battery voltage and current in V/A
- Target charging voltage in V
This means that the SOC curve in the multicluster can be shown, for example (Figure 5), and that for the first time system errors can be detected at a glance in Sunny Portal. If a battery reaches a full state of charge very early or frequently becomes warmer than other batteries in the cluster, for example, this may indicate a battery defect, which means that the operator can take action to replace the battery before any unexpected system failure occurs. Measured values for all system devices can also of course be compared on a diagram (Figure 6), or the events that occurred during the period under analysis can be listed.
Tip: Operators can use the event monitor filter to gain a better overview of the events in a given period.
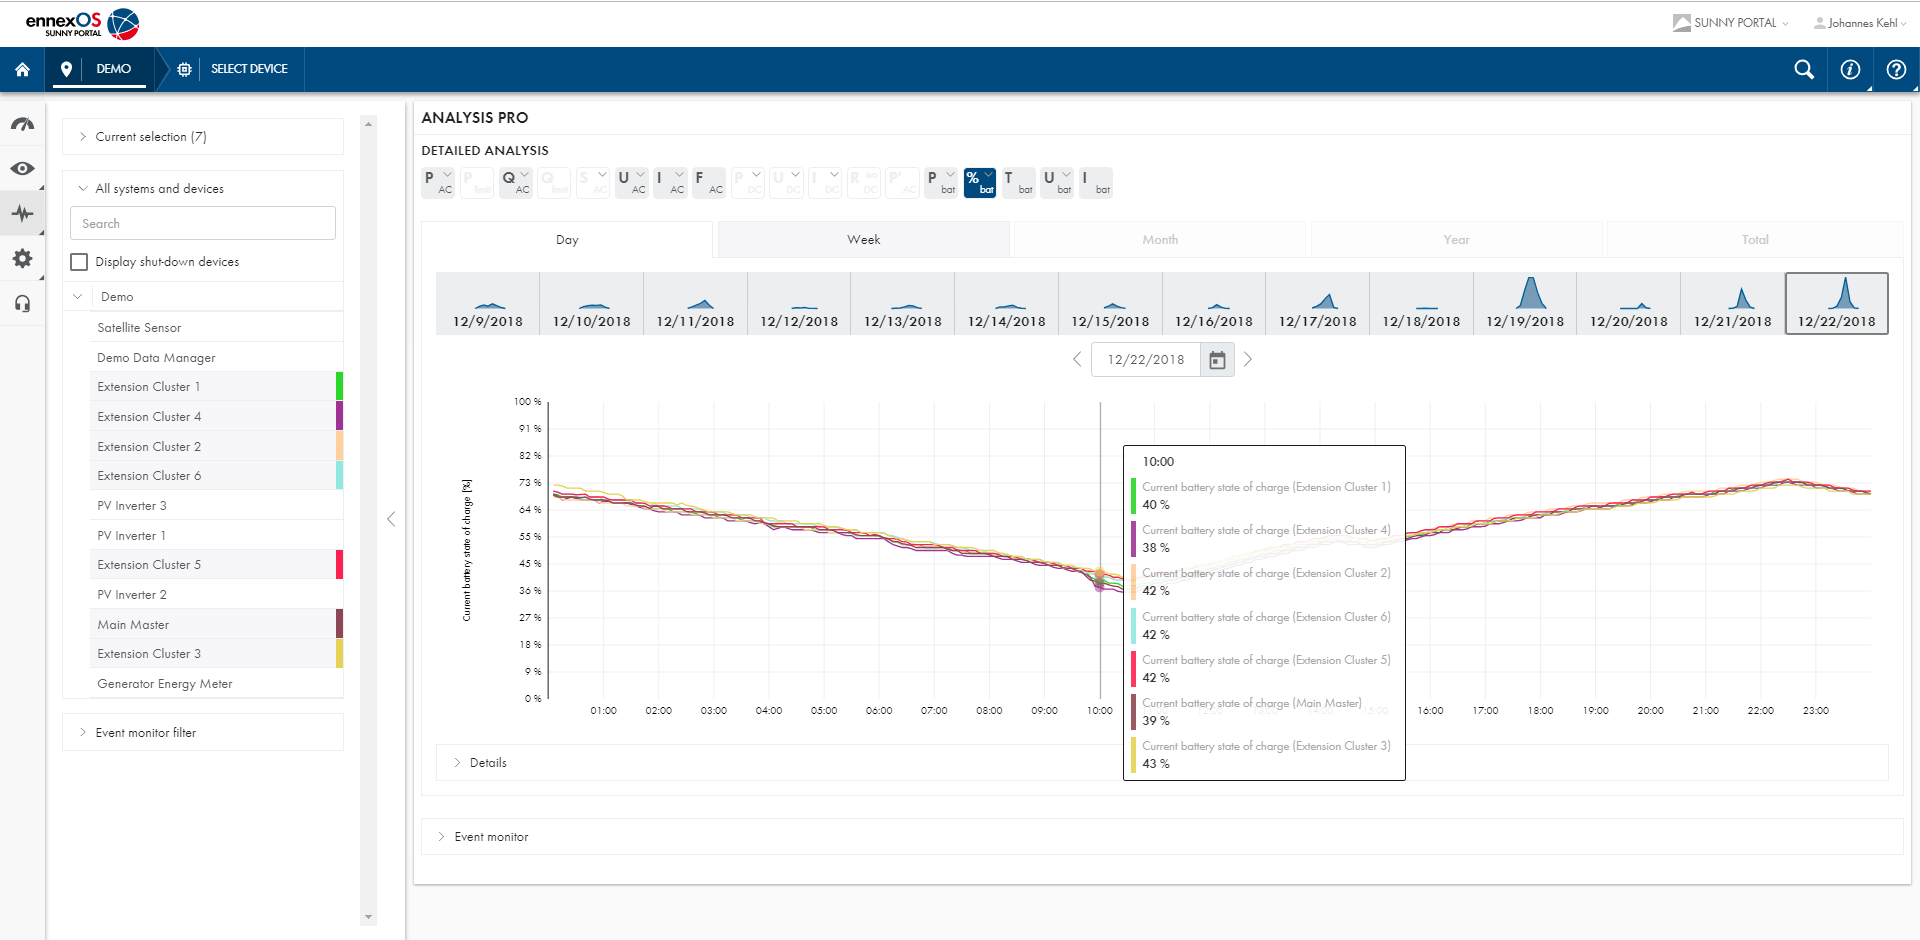
Figure 5: SOC of a multicluster visualized in Analysis Pro
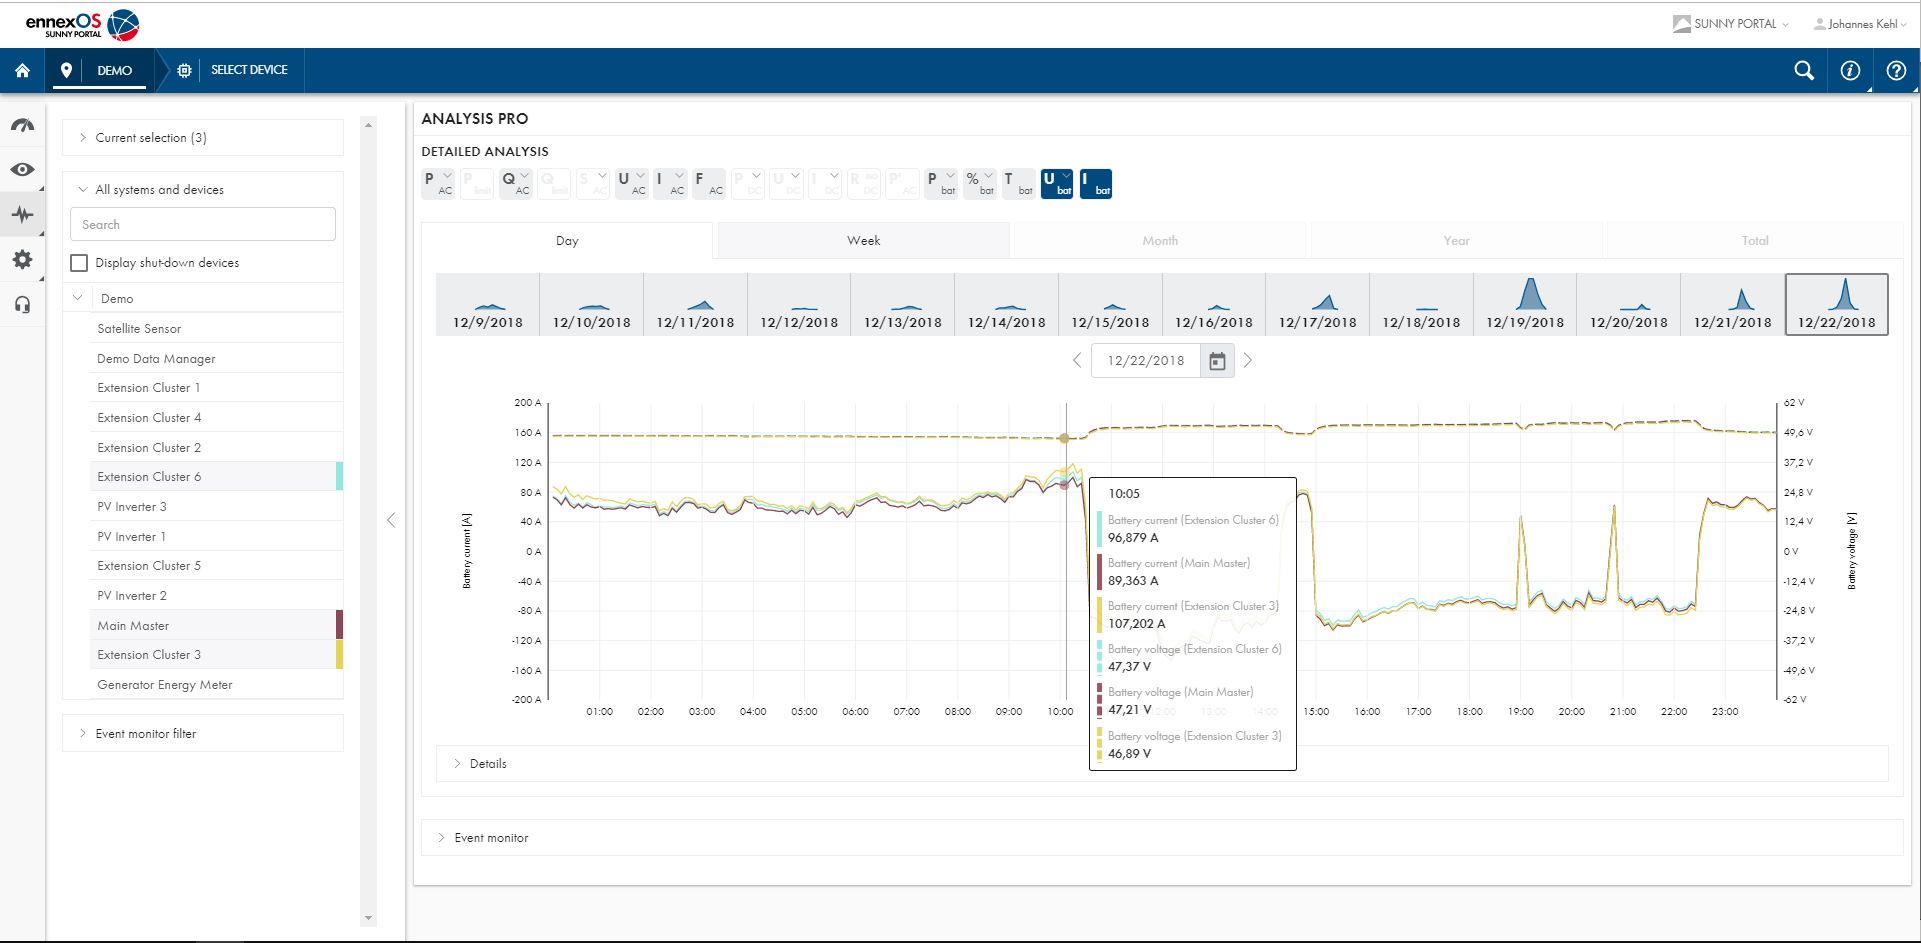
Figure 6: Battery current and voltage compared on a diagram
Incidentally, in Sunny Portal powered by ennexOS, you can display deactivated or replaced devices via Analysis Pro with a single click. To do so, simply click the “Display shut-down devices” button and the entire system history will once again be shown.
The analysis tool helps you identify potential failures early on and saves both money and unnecessary work. Why not try it out for yourself?


Saludo a todos trabajo para una institucion del estado que tenemos mucho inversores sunny lsland 48vdc a 4.4kl dañado tamos necesitando piesa para la reparacion y acesoria por fabor le dejo mi wasa 18297847846 republica dominicana
Hello Bienvenido,
Please contact your local SMA Service for further support.
Sunny regards
Christiane
Hi Sebego,
the chart “Energy and power – battery” is automatically available with Data Manager and Sunny Portal powered by ennexOS when using a battery inverter within your system. Please keep in mind that we currently have two Sunny Portals – the “old” Sunny Portal doesn’t support that features.
If you login to Data Manager WebUI and navigate to your battery inverter, you will find “Energy and Power – battery” among the submenu of monitoring (the “eye symbol”).
The same chart is available within Sunny Portal powered by ennexOS on device-level (e.g. Sunny Island) as well as system-level (e.g. SI Multicluster).
Customizing the dashboard is currently only available with limited functions. E.g. deactivating available widgets by unselecting the checkboxes top right of the dashboard.
Hopefully, that answers your questions.
Best regards,
Johannes.
Hi Sebego,
thanks a lot for reading the article and for your questions.
You can connect maximum three Sunny Islands to one common battery. We call this three Sunny Islands a “Singlecluster” which provide power at three different phases (L1-L3). If you have a higher power demand, you can parallel install up to 9 Singlecluster (= 36x Sunny Island). In this case, you would have 9 batteries.
It’s not possible to connect one battery to 12 Sunny Islands because every Singlecluster has an independent controller. The Sunny Islands in the above picture have three batteries.
If you still have questions, please don’t hesitate to write us!
Best regards,
Johannes.
Hi,
Your article is quite interesting.
We cannot find a chart view like the “ Energy and power – battery ” chart shown in Figure 2: of your article. This “ Energy and power – battery ” chart would be very useful for our off-grid system.
Where can we find an SMA user guide that we can download explaining where we can find the “ Energy and power – battery ” chart or how to configure the UI of the ennexOS Sunny Portal ? The manual for DATA MANAGER M provides only very basic information regarding the ennexOS Sunny Portal UI, it does not explain how to customize the UI.
We currently can extract from the ennexOS Sunny Portal connected to the DATA MANAGER M of our system many relevant information but we do not find how we can reconfigure / customize for example the Dashboard (like adding new widgets).
Thank you
Hello,
i have questions concerning your picture. Is it possible to connect all sunny island (i see here 12 SI) on the same battery bank? if yes how, and if no why?
Dear Napat,
if you have just 3x Sunny Islands connected in series with the grid (grid connected to AC2 and loads connected to AC1) and the system is running in off-grid mode, you can set into the grid parameters of the when the SI should be able to connect the grid (the SI just open and closes an internal switch). As far as the grid is connected, it will charge the batteries.
Regards,
Isabel
Dear Isabel,
Thank you very much for your response.
For your recommendation, Is it possible to supply the electricity from the grid together with battery discharge to the loads ?
Best regards,
Thank you
Napat
Hi Johannes,
Your work is so interesting.
My system also have 3 phase Sunny islands with sma smart meter however my system don’t have PV system.
For my application, I want charge battery at night from grid and discharge to the load in day time however I can not do this with current system. I plan to add sma data manager m in my system.
Do I can setting time for charge and discharge by sma data manager m?
Best regards,
Thank you